
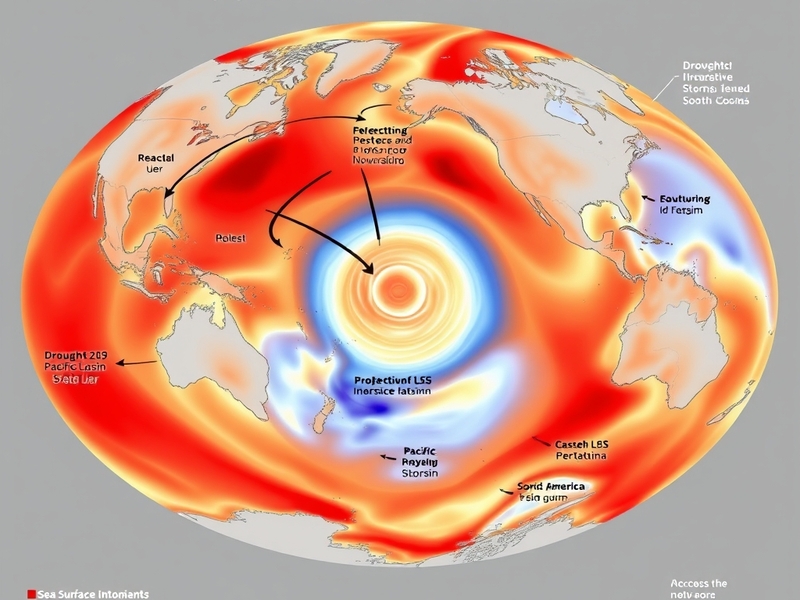
The term “Super El Niño” has become one of the most closely watched climate phenomena in recent years, especially as its impacts ripple across global weather patterns. Unlike regular El Niño events, which typically bring warmer-than-average sea surface temperatures in the central and eastern Pacific, a “Super El Niño” is characterized by its intensity and far-reaching consequences. These events are marked by sea surface temperature anomalies exceeding 2°C above normal, often triggering dramatic shifts in precipitation, temperature, and extreme weather events worldwide.
Understanding the spatial and temporal footprint of a Super El Niño is critical for meteorologists, policymakers, and communities preparing for its effects. The scientific community has developed sophisticated mapping tools to visualize these patterns, helping stakeholders anticipate risks such as droughts in Australia, heavy rainfall in South America, and disrupted monsoons in Asia. These maps are not just academic exercises—they are lifelines for regions bracing for potential disasters.
What Defines a Super El Niño?
A Super El Niño is more than just a strong El Niño; it’s a climate anomaly with global repercussions. The criteria for classification go beyond sea surface temperature anomalies. According to the National Oceanic and Atmospheric Administration (NOAA), a Super El Niño must exhibit anomalies of at least 2°C in the Niño 3.4 region of the Pacific for at least three consecutive months. This threshold distinguishes it from weaker or moderate events, which may only reach 1-1.5°C above normal.
The intensity of a Super El Niño often correlates with its duration. These events can persist for 12 to 18 months, prolonging their impact on global weather systems. The 1997-1998 and 2015-2016 Super El Niños are prime examples. During the 1997-1998 event, sea surface temperatures in the eastern Pacific soared to 5°C above normal in some areas, leading to catastrophic flooding in Peru and severe droughts in Indonesia. Similarly, the 2015-2016 Super El Niño caused widespread coral bleaching in the Pacific, disrupted fisheries in Ecuador, and contributed to one of the strongest Atlantic hurricane seasons on record.
What makes these events particularly challenging is their unpredictability. While scientists can forecast the development of an El Niño with reasonable accuracy, predicting its intensity remains difficult. Factors such as ocean heat content, wind patterns, and interactions with other climate systems like the Indian Ocean Dipole add layers of complexity to forecasting models.
The Role of Mapping in Understanding Super El Niños
Maps are indispensable tools for visualizing the spatial and temporal dynamics of a Super El Niño. These visualizations typically combine satellite data, ocean buoy measurements, and climate models to create real-time and predictive representations of sea surface temperatures, atmospheric pressure anomalies, and precipitation patterns. One of the most widely used resources is the NOAA Climate Prediction Center’s El Niño Southern Oscillation (ENSO) maps, which provide weekly updates on sea surface temperature anomalies across the Pacific.
Advanced mapping techniques now incorporate machine learning and ensemble forecasting to improve accuracy. For instance, the European Centre for Medium-Range Weather Forecasts (ECMWF) uses a multi-model approach to generate probabilistic maps that show the likelihood of different temperature anomalies occurring in specific regions. These maps are particularly useful for governments and humanitarian organizations planning for potential disasters.
Visualizing the impacts of a Super El Niño requires more than just temperature maps. Precipitation anomaly maps, for example, highlight regions at risk of flooding or drought. Wind anomaly maps illustrate the disruption of trade winds, which can alter storm tracks and monsoon patterns. By layering these different types of data, scientists can create comprehensive maps that provide a holistic view of a Super El Niño’s influence.
Interactive maps have also democratized access to this information. Platforms like NASA’s Earth Observatory and NOAA’s Climate.gov offer user-friendly interfaces where users can explore historical Super El Niño events, compare current conditions, and simulate future scenarios. These tools empower not just researchers but also journalists, educators, and the general public to engage with climate science in meaningful ways.
Global Impacts: From Coral Reefs to Crop Yields
The ripple effects of a Super El Niño extend far beyond the Pacific. One of the most visible impacts is on coral reefs. Elevated sea surface temperatures trigger mass bleaching events, where corals expel the algae that provide them with food and color. The 2015-2016 Super El Niño, for example, caused widespread bleaching across the Great Barrier Reef, with some areas experiencing up to 90% mortality rates. Recovery for these ecosystems can take decades, if it happens at all.
Agriculture is another sector heavily affected by Super El Niños. Regions like Southeast Asia and Australia often experience severe droughts, leading to crop failures and water shortages. Wheat, rice, and palm oil production can plummet, driving up global food prices. In contrast, parts of South America may see bumper harvests due to increased rainfall, though these gains are often offset by losses elsewhere. The 1997-1998 Super El Niño, for instance, contributed to a 10% drop in global rice production, exacerbating food insecurity in vulnerable regions.
The health sector also feels the strain during Super El Niños. Increased temperatures and humidity create ideal conditions for disease vectors like mosquitoes, leading to outbreaks of dengue fever, malaria, and Zika virus. In 2015, the Pan American Health Organization reported a 30% increase in dengue cases in Central and South America, directly linked to the Super El Niño’s influence on local climates. Meanwhile, regions experiencing flooding may see spikes in waterborne diseases like cholera and leptospirosis.
Infrastructure and energy systems are not immune to the disruptions either. In California, Super El Niños often bring heavy rainfall, increasing the risk of landslides and flooding. The 2015-2016 event caused an estimated $3 billion in damages to the state’s infrastructure, including road closures and power outages. Conversely, regions like Indonesia and the Philippines may experience prolonged dry spells, straining water supplies and increasing the risk of wildfires.
Preparing for the Next Super El Niño
As the frequency and intensity of Super El Niños appear to be increasing, experts emphasize the need for proactive preparation. One of the most critical steps is improving early warning systems. Countries like Peru and Ecuador, which are often on the front lines of Super El Niño impacts, have invested in better monitoring networks and public awareness campaigns. These efforts include educating communities about flood risks, stockpiling emergency supplies, and reinforcing infrastructure to withstand extreme weather.
International cooperation is also vital. The World Meteorological Organization (WMO) coordinates global efforts to share data and best practices for managing Super El Niño risks. For example, the WMO’s Global Framework for Climate Services provides tailored climate information to governments, helping them make informed decisions about disaster risk reduction and resource allocation.
Agricultural adaptation strategies are another key focus. Farmers in drought-prone regions are turning to drought-resistant crop varieties and precision irrigation techniques to mitigate losses. In some cases, shifting planting schedules or diversifying crops can help communities adapt to changing precipitation patterns. Governments and NGOs are also promoting agroforestry and soil conservation practices to enhance resilience against future Super El Niños.
Urban planning must evolve as well. Cities in flood-prone areas are investing in green infrastructure, such as permeable pavements and retention ponds, to manage excess rainfall. Meanwhile, coastal communities are strengthening flood defenses and restoring natural barriers like mangroves to protect against storm surges. These adaptations not only reduce immediate risks but also build long-term resilience against the increasing threats posed by climate change.
The lessons learned from past Super El Niños underscore the importance of preparedness. The 1997-1998 event caught many regions off guard, leading to significant loss of life and economic damage. In contrast, the 2015-2016 Super El Niño saw more coordinated responses, thanks to improved forecasting and communication. Yet, even with these advancements, challenges remain. Climate change is altering the baseline conditions under which Super El Niños develop, making it harder to predict their behavior with certainty.
Ultimately, addressing the challenges posed by Super El Niños requires a multifaceted approach. Scientists must continue refining their models to account for the evolving climate. Policymakers need to prioritize investments in early warning systems and adaptive infrastructure. And communities must remain vigilant, using the best available tools—like Super El Niño maps—to stay one step ahead of the next big event.